At the end of this assignment, students should be able to:
1. Demonstrate an increased knowledge of food waste and awareness of the need to reduce food waste.
2. Develop an effective educational tool through the creation of a narrated PowerPoint presentation on food waste.
Purpose of the Assignment
Food waste is a serious issue in Canada. Canadians waste $31 billion of food annually, and that half of the waste occurs at the household level. There are significant social, environmental, and economic implications for our society.
The purpose of this assignment is to develop an educational tool to raise awareness about food waste issues and offer strategies for reducing food wastage. Dietetic interns will create a narrated PowerPoint presentation on food waste reduction by incorporating multimedia elements to enhance learning. The final product will be used as an educational tool for community members working in the food services area.
Deliverables
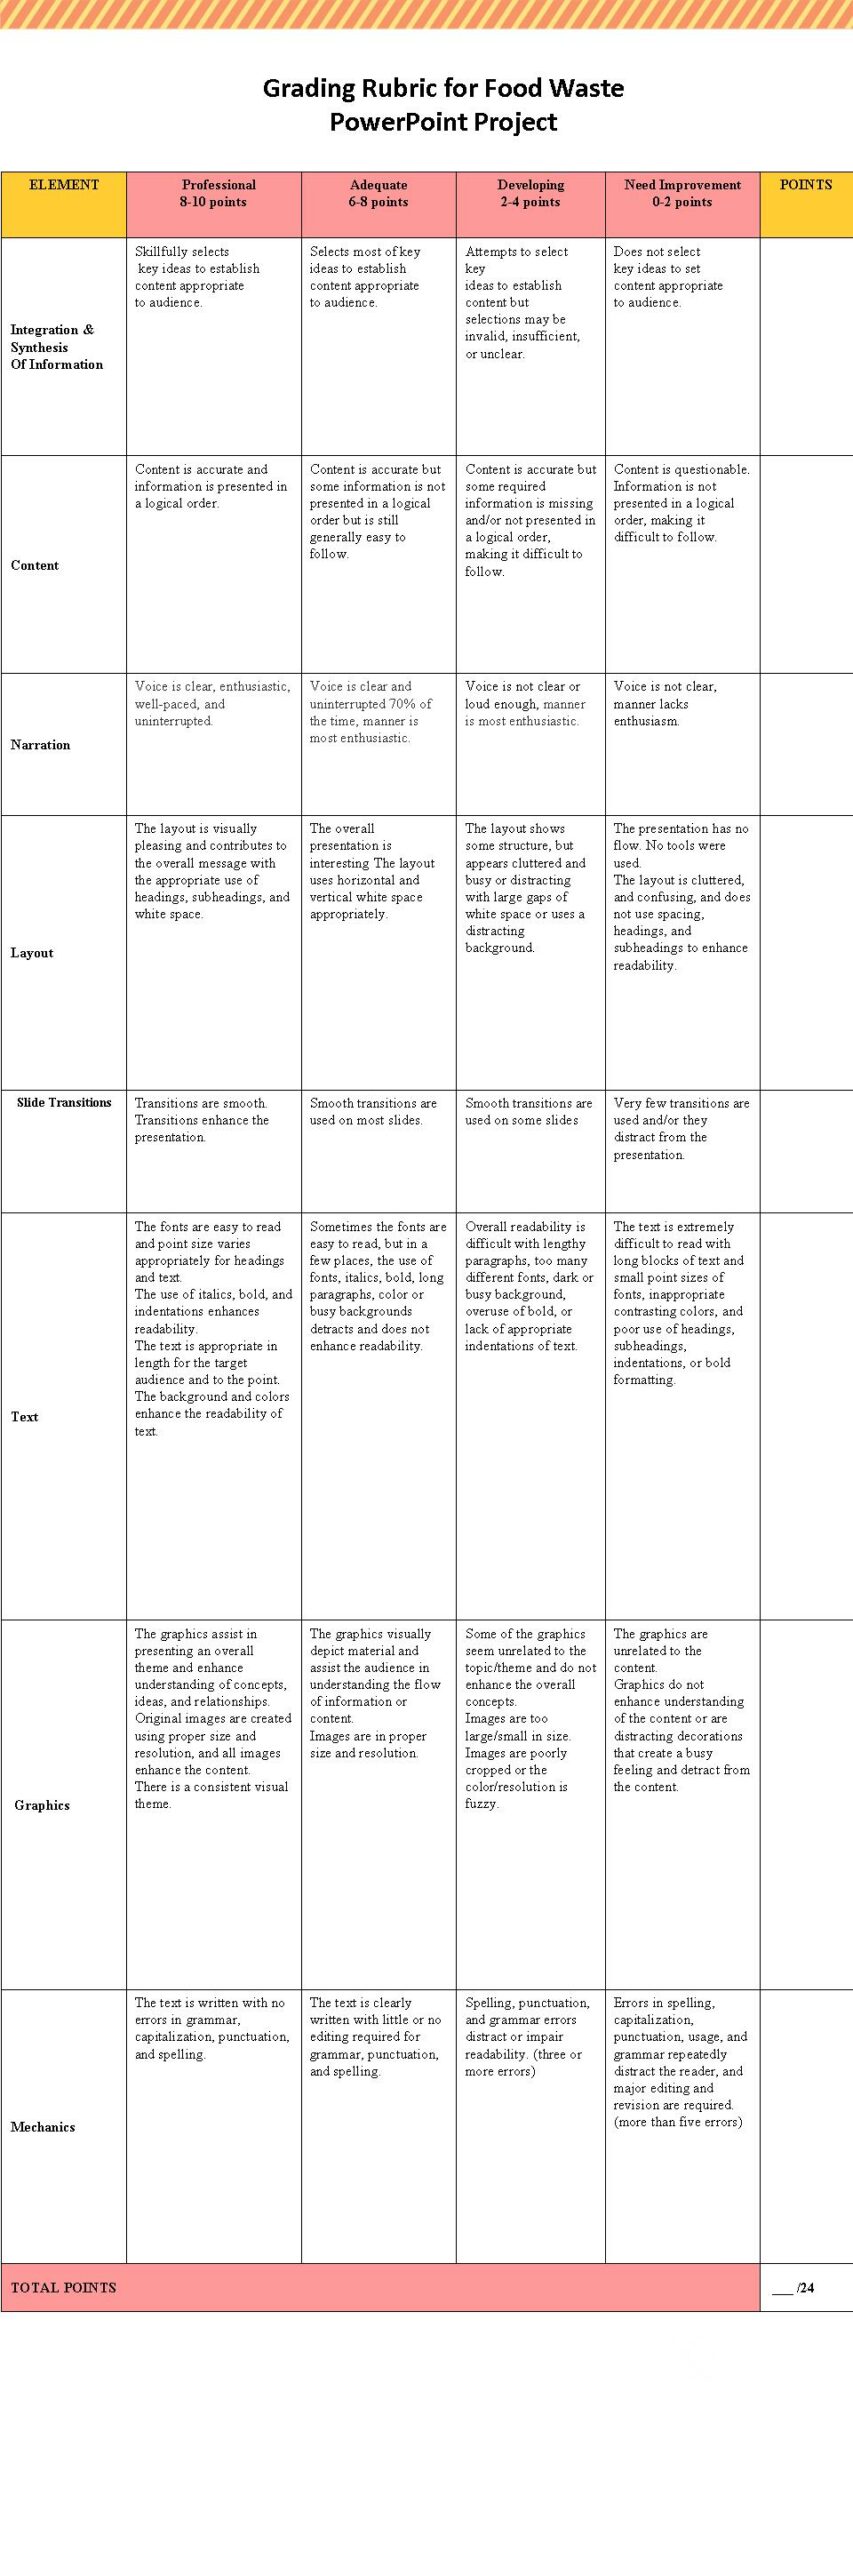
Interns will work in pairs to create a 10-15 minute food waste educational PowerPoint presentation (with an audio narration voiceover) using background information provided to them. The PowerPoint presentation will be assessed for information synthesis skills, contents (accuracy, understanding of the topic), communication (quality of narration), and technical components (text, graphics, aesthetic appeal, layout, writing).
Process
Interns will use Microsoft PowerPoint to create slides and record audio narration voice-over for the educational topic.
Interns can review the steps of creating a narrated PowerPoint presentation here:
PowerPoint: How to Add Audio to Powerpoint on Windows 10 and Mac
Timescale
This is one of the projects that dietetic interns have to complete during their 5-week placement with the Health Unit.
During the first week, interns will review research and background information provided to them on food waste in preparation for the project.
During the second week, interns will create slides and search for images to be used on the slides.
During the third week, interns will develop a script, and set up timing for each slide.
During the fourth week, interns will rehearse, and record narration for each slide
During the fifth week – Interns will present the draft presentation to the preceptors. Interns will then modify their presentation based on the feedback received.
References
Provision Colition (2013). Developing an industry led approach
to addressing food waste in Canada.
https://provisioncoalition.com/assets/website/pdfs/Provision-Addressing-Food-Waste-In-Canada-EN.pdf
Schrock, K. (2019). Assessments and rubrics. Kathy Schrock’s Guide to Everything.
http://www.schrockguide.net/assessment-and-rubrics.html
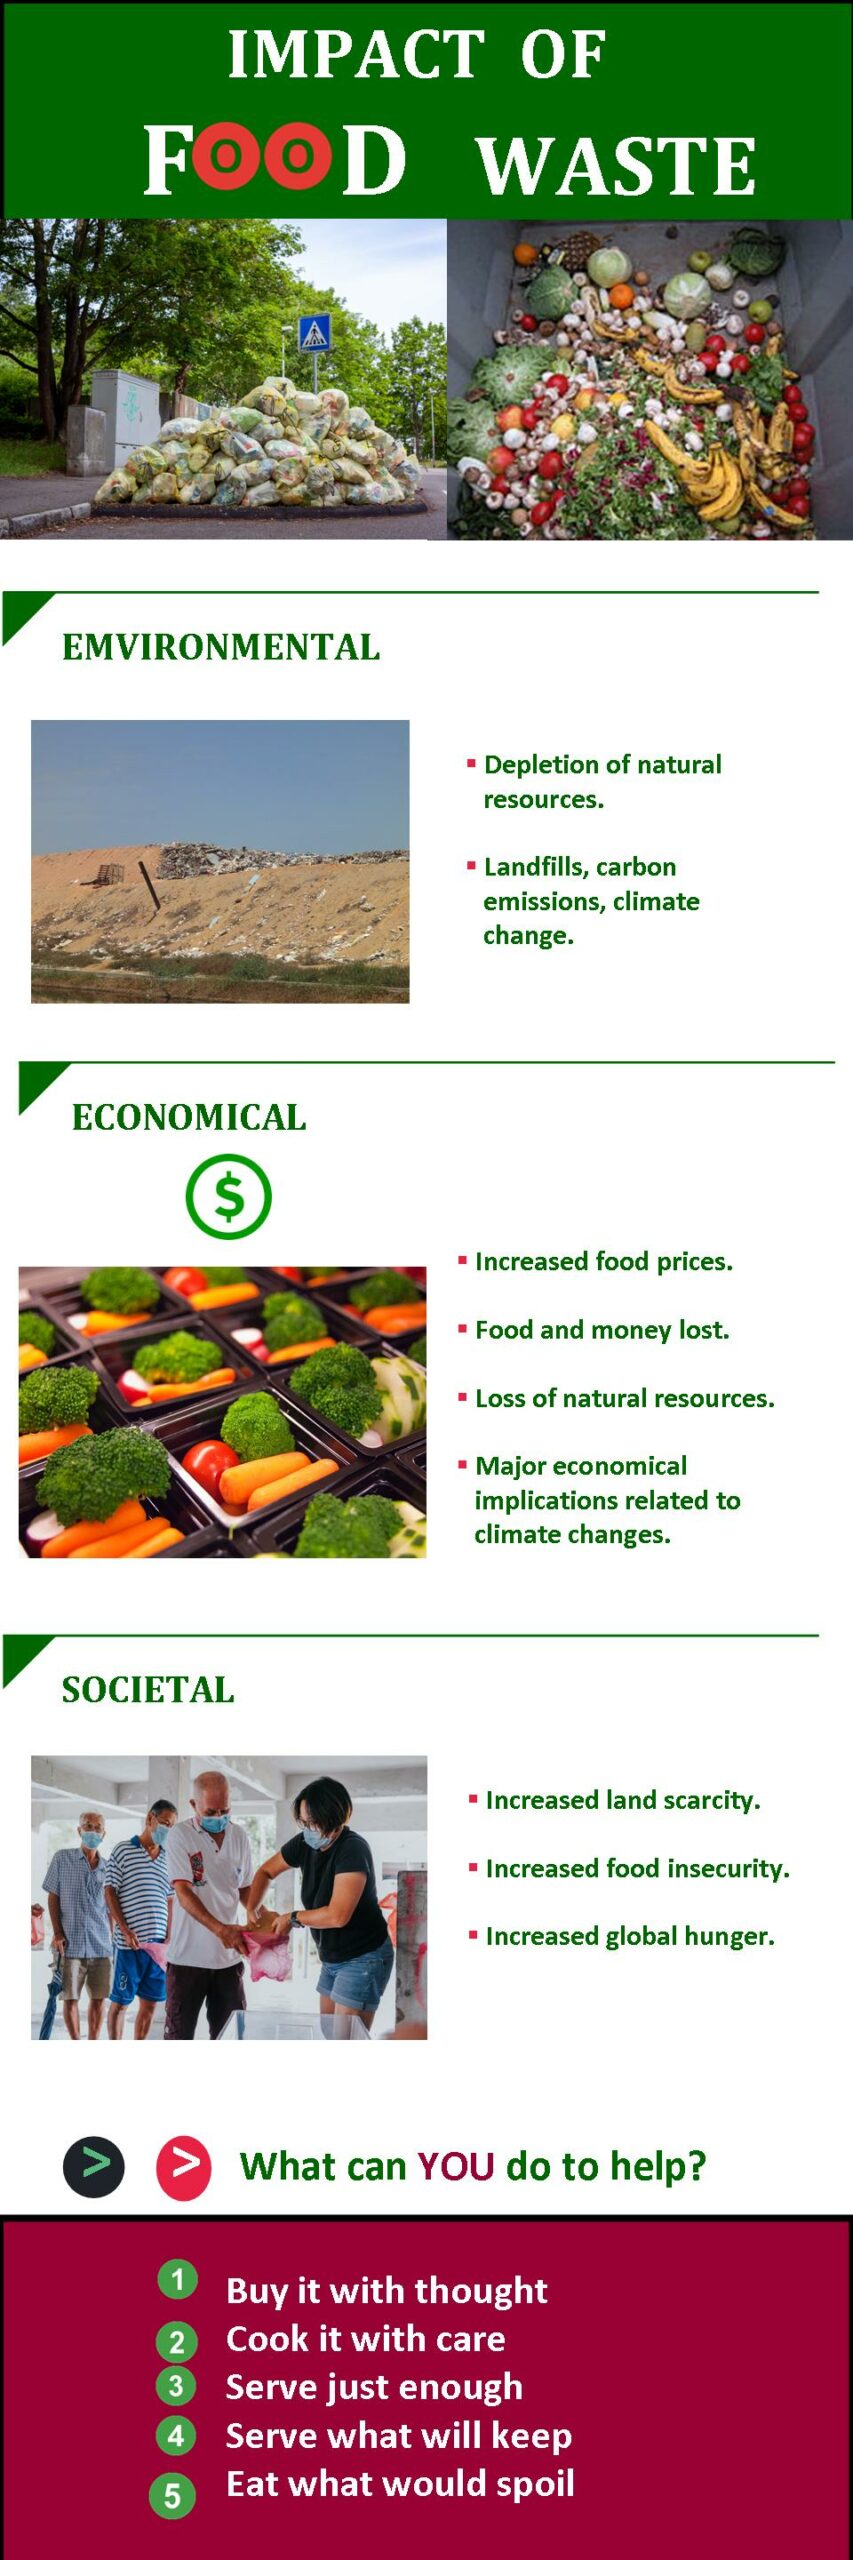
Learning Outcomes: Audience will be able to identify and describe environmental, economical, and societal impacts of food waste and identify some steps to help reduce waste.
I used a PowerPoint template that I found on HubSpot to create my food waste infographic. The choices of template are quite limited with the free version. However, I managed to find one that could work with my learning goal.
Below are my attempts to increase the effectiveness of the infographic by applying a few of the strategies and rules put forth by Dunlap Dunlap and Lowenthal (2016) and Balliett ( 2011 ):
TYPOGRAPHY HAS ITS PLACE
Since some audience may find the topic uninteresting, I used a fun and eye-catching font for the title to create some excitement. Lines were also used to break up the content.
TELL A STORY
My infographic consisisted of three components: an introduction (a problem statement), a support piece (impact of food waste), and a conclusion (actions). This aligned with Balliett’s (2011) suggestion to tell a story on your infographic.
VISUALIZE THE HOOK
I placed the hook (What can you do to help?) at the very end of the infographic to grab more attention. Balliett (2011 ).
AVOID WHITE AS A BACKGROUND WHENEVER POSSIBLE.
Although white background should be avoided, with the free template, I was not able to change it to a different colour. Given the background is not completely white, readers should still be able to read it. Balliett ( 2011).
RULE OF THREE
I used three primary colours on the infographic: white, green, and red. Balliett (2011).
USE RELEVANT IMAGES
I used relevant images instead of decorative visuals. Dunlap and Lowenthal (2016).
CLEAR FOCUS
I had a clear focus and purpose for my infographic – food waste impacts and what we can do about it. Dunlap and Lowenthal (2016).
LENGTH
My infographic was no longer than two pages long. Dunlap and Lowenthal (2016).
MALLEABILITY
I incorporated reflection prompts and questions to engage the audience. Dunlap and Lowenthal (2016).
City of Hamilton (2016). Household food waste PowerPoint presentation to Community Food Advisors.
Dunlap, J. C. & Lowenthal, P. R. (2016, September 8). Getting graphic about infographics: Design lessons learned from popular infographics. Journal of Visual Literacy, 35(1), 42–59. https://doi.org/10.1080/1051144X.2016.1205832
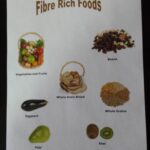
Create a poster to show some examples of fibre-rich foods
Goal: The purpose of this assignment is to create a poster to show some examples of fibre-rich foods
Scope/Boundaries: This is an individual work activity. Students will create a poster using Microsoft Word to show some examples of fibre-rich foods they learned in class. Each food item must be clearly labeled. Students will search for food images from a list of websites provided. This poster is a living document, more fibre-rich foods can be added to the poster later on. Students can use the poster as a study aid to help them store information.
Tutorial: Students will be provided with a short demonstration on how to use some features in the Microsoft Words such as text box, WordArt, colour and lines, AutoShapes and how to insert images into a document.
Students will also be provided with the following websites to search for food images.
Climate change is a serious and urgent problem we face these days. You may have heard of the term “climate change” in the media many times. But do you know what it is and how it will affect us? In order to take climate action, you first need to understand the basics. In this lesson, you will learn a number of terms related to climate change as well as the causes and effects of climate change. In the next few lessons, you will learn many other aspects of climate change including the practical solutions that can help protect our planet’s future.
Learning Outcome
When you have completed this lesson you should be able to:
describe the terms “global warming” and “climate change” and identify at least three threats of climate change to the planet.
Instructions for Completing This Section
Review glossary on the Environmental Protection Agency website then complete Activity 1 as per given instructions.
Review the section content on climate change.
Watch the video presented.
Complete the three questions under Activity 3.
Activity 1. Basic Climate Change Terms
Look up the definitions of the climate change terms listed in the first column of Table 1 on the Environmental Protection Agency (EPA) website:
Complete the table below, write the definitions on the second column.
Table 1. Basic Climate Change Terms
Term
Definition
Climate Change
Global Warming
Greenhouse Gases
Greenhouse Effect
Methane
2. What is climate change?
Climate change describes a long term shift in the Earth’s climate including temperatures and weather patterns such as rainfall and snowfall.
Earth’s climate has never been static; it changes over long periods of time, moving in and out of ice ages and warmer periods. However, the pace of change in recent decades has been dramatically accelerating, causing worldwide concern. If we do not take steps to do something about it now, the detrimental effects on earth could be irreversible.
What is global warming?
Although the terms “climate change” and “global warming” are often used interchangeably, there is a subtle difference between two the terms. Global warming is the overall phenomenon whereby global average temperatures are slowly increasing. Climate change is the result of global warming. That is, as global temperatures increase, climatic conditions change in various ways.
Why is climate change happening?
There are various reasons for the rising Earth’s temperature, for example, greenhouse gases emanating from carbon dioxide (CO2) emissions, burning of fossil fuels, cutting down trees and destroying wetlands. The Earth gets heat from the sun. In the atmosphere, greenhouse gases like carbon dioxide trap this heat and keep it from escaping back to outer space. As carbon dioxide and other greenhouse gases build up in the atmosphere, they trap more of the heat that radiates from Earth’s surface as it absorbs sunlight. All this extra carbon dioxide is trapping more heat in the atmosphere, leading to substantial increase in temperature making and causing other climate changes, too.
What are the impacts of a changing climate?
The signs of climate change are all around us. You have no doubt seen many negative effects of climate change reported in the news by now, for example, extreme weather events, devastating flooding, widespread wildfires, and powerful tornadoes.
Climate change affects our wellbeing and the health of our planet. It is causing severe and widespread disruption and affecting the lives of billions of people around the world. Below are some examples of effects of climate change:
Heat waves – heat waves are a natural part of weather variation. However, they are expected to occur more frequently as the result of rising Earth temperature. This can lead to more heat-related illnesses and deaths.
Heavy precipitation and storms – heavy precipitation, such as rain or snow, is becoming more common in many areas. These changes can lead to droughts and fires in some areas, and flooding in other areas.
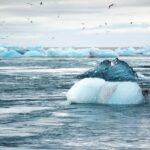
Sea level rise – the sea levels are constantly rising because glaciers and ice sheets are melting and seas are warming. Rising waters can threatening to inundate small-island nations, low-lying cities, low-lying, erodes shorelines as well as flooding and loss of many marshes and wetlands.
Threats to habitats and animals – wildlife can not survive without a healthy habitat. The effects of changing climate such as extreme temperatures, rising sea levels, flood can threaten the habitat of many plants and animals. Animal populations are gradually vanishing and may even extinct as there has been a widespread loss of their habitat.
Ocean acidification – extra carbon dioxide in the atmosphere is absorbed by the oceans, making them more acidic. This can have negative overall effects on many marine species, alter marine food chains and food supply to humans.
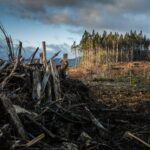
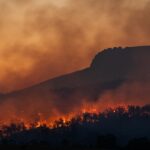
Wildfires – uncontrolled wildfires can be deadly, destroying homes, and wildlife habitat, and increasing carbon dioxide levels in the atmosphere. In addition, ashes destroy much of the nutrients and erode the soil, causing flooding and landslides.
Drought – a drought is a period with little rain and not enough water. If the planet keeps getting warmer, we can expect more droughts in some places which will make it harder to grow food.
Activity 3: Complete the Following three Questions
In the video, Campbell Baron talks about the science of climate change and how it might affect Canadian kids. Having watched the video, please answer the following three questions:
Does the term “climate change” mean the same thing as the term “global warming”? Please explain your answer.
Why do you think climate change is happening? Is it too late to do something about it?
Draw a diagram to show the cumulative effect generated by a rise in global temperature based on the video you watched.
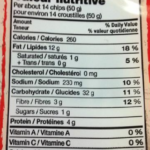
I found a graphic to support a learning outcome for one of my ESL lessons on food label reading. Although it is not a very good image, I used it mainly for practice purpose.
Learning Outcome:
At the end of this lesson, students will be able to identify key nutrients on the Nutrition Facts table.
The image has some extraneous details that may present as a distraction, so I cropped it in a way that it shows only the Nutrition Facts Table which is the main focus of the lesson. This way it will enable learners to build a better mental representation of what a standard food label looks like in Canada. (This supports Mayer’s (2014) principle of essential process).
I used a web-based application called Photopea to trim the image. I found the application and the process very easy and straightforward. I believed that this application will be quite useable for me in the future.
Mayer, R. E. (2014). Multimedia instruction. In J. M. Spector, M. D. Merrill, J. Elen, & M. J. Bishop (Eds.), Handbook of research on educational communications and technology (4th ed., pp. 385-399). Springer Science & Business Media. https://doi.org/10.1007/978-1-4614-3185-5
The image of the wildfires provide an example of effects of climate change. Uncontrolled wildfires can be deadly, destroying homes, and wildlife habitat, and increasing carbon dioxide levels in the atmosphere. In addition, ashes destroy much of the nutrients and erode the soil, causing flooding and landslides.
Climate change affects our wellbeing and the health of our planet. It is causing severe and widespread disruption and affecting the lives of billions of people around the world.
I added the NoCoffee extension to my Mozilla Firefox browser and played around with the sliders for vision disability simulations. I must admit that the tool is very helpful for me to understand some of the problems faced by people with sight to extreme vision problems such as low acuity and glucoma. Being aware of how people with visual impairments may be viewing the sites is a good start to inform the way we design our web projects.
With that in mind, I decided to look at an online resource, OLDER ADULT NUTRITION SCREENING, to see how accessible it is for individuals with visual impairments.
High Contrast Display
The website was designed with high contrast colours. Black text on a white background is easy to read and the blue subheading really stands out.
Clear Sans Serif Font
The website uses a simple to read sans serif font (Arial) which is one of the recommended fonts to use. The heading, subheading and body text are in appropriate sizes. I was also able to enlarge text by using ctrl+ shortcut on the keyboard.
Compatible with Screen Readers
The website uses proper headings which allow screen reader to figure out where the main content is.
No Popups
I noticed the website does not give a popup for email list sign up or other random information. Popups can be annoyed and hard to get rid of for individuals with visual impairments.
Overall, the use of high contrast display and clear sans serif font, the compatibility with screen readers and, the absence of popups make this website a bit more accessible for people with visual impairments.
I am always looking for recipes to use in my cooking program, especially healthy recipes from reliable sources such as Health Canada and Dietitians of Canada. I am interested in finding out whether the Cookspiration (https://www.cookspiration.com/), a recipe webpage, created by Dietitians of Canada,meets the four WCAG guidelines for accessibility. The overall finding is that this web page is not very accessible for a wide range of abilities and needs.
Below are my assessments of the web resource:
Perceivable – web content is made available to the senses; the users can take the information through sigh, sound, and touch
No audio or video is provided as an alternative to web content.
Operable – interface forms, controls, and navigation are operable. How the users navigates their way through the content, the way they interact with the
information
Images of recipes are representative of the food products and are clearly labeled;
The light blue heading text colour used does not provide enough contrast;
The Font size used in recipe instructions is too small.
Understandable – content and interface are understandable. The content is structured in a logical predictable way and that include learning support.
The content is presented in a logical predictable way;
The recipe follows a standard format with clear, simple and understandable steps;
The amounts of ingredient needed are provided in both imperial and metric measurements;
The recipes also include learning support such as tips, nutrition and notes, and dietitian’s messages which are helpful for everyone.
Robust – content can be used reliable by a wide variety of user agents, including assistive technologies
The contents can be used with iPad and Android phone;
Unsure if the contents interact with different types of assistive technology.

Recent Comments